Debug drawing
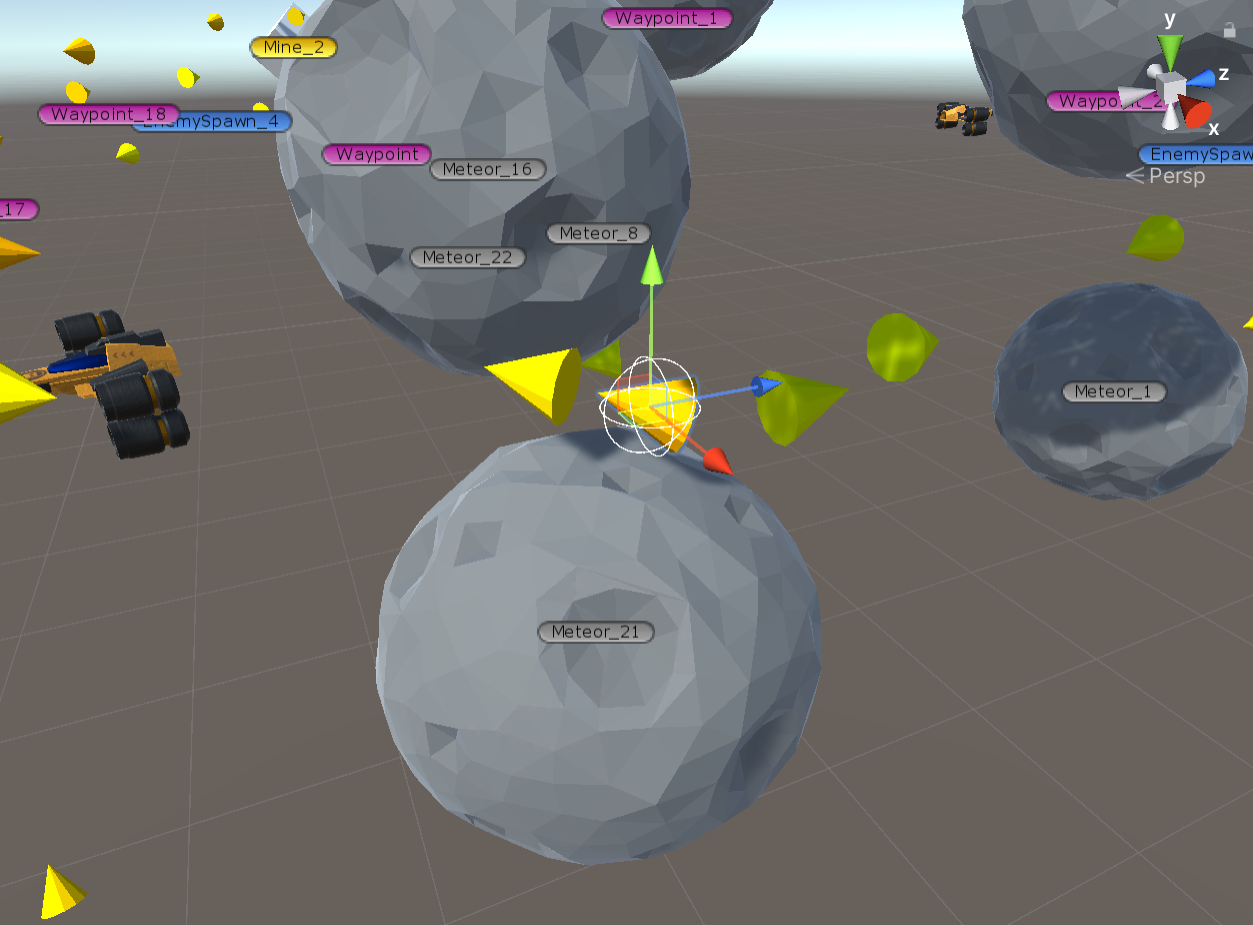
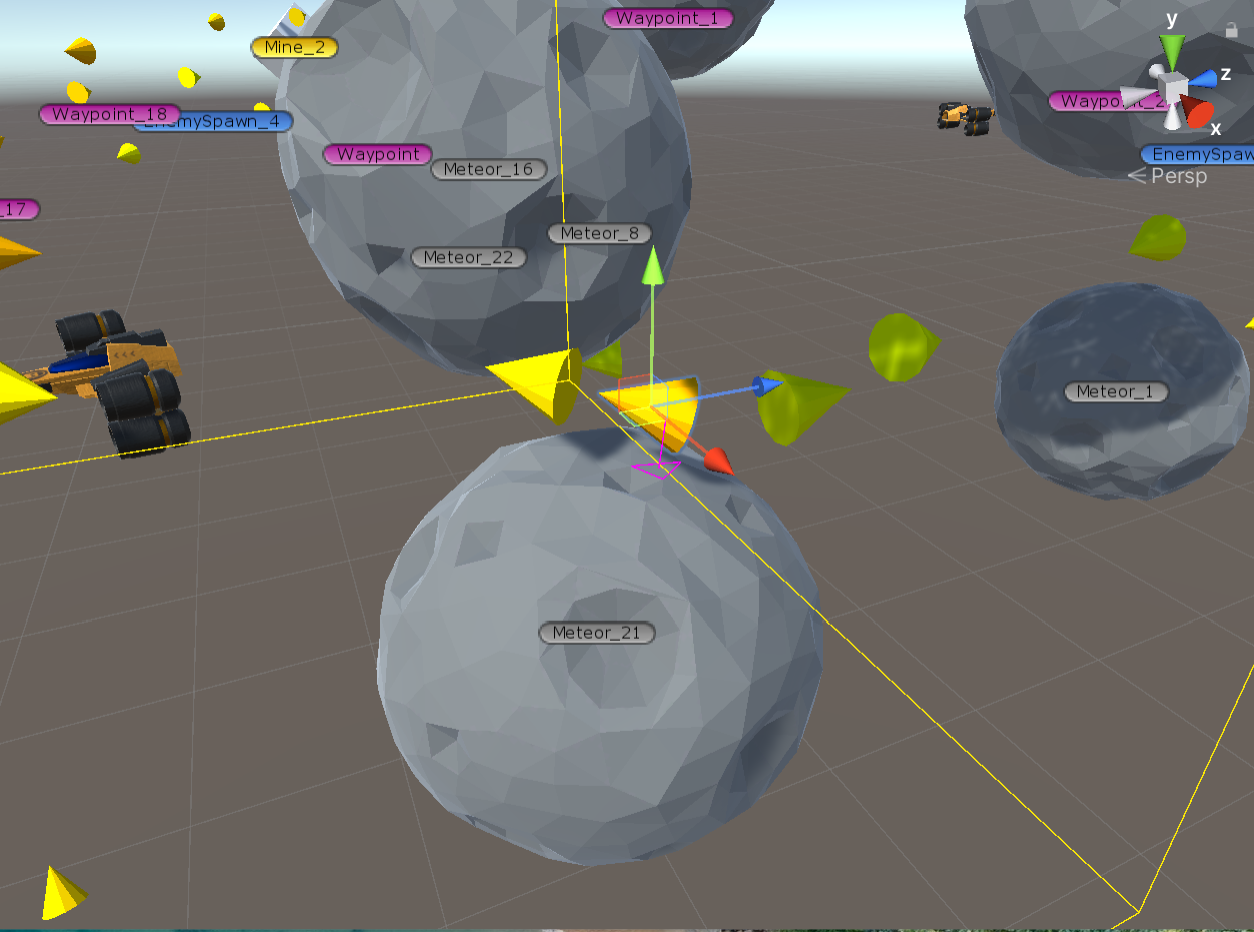
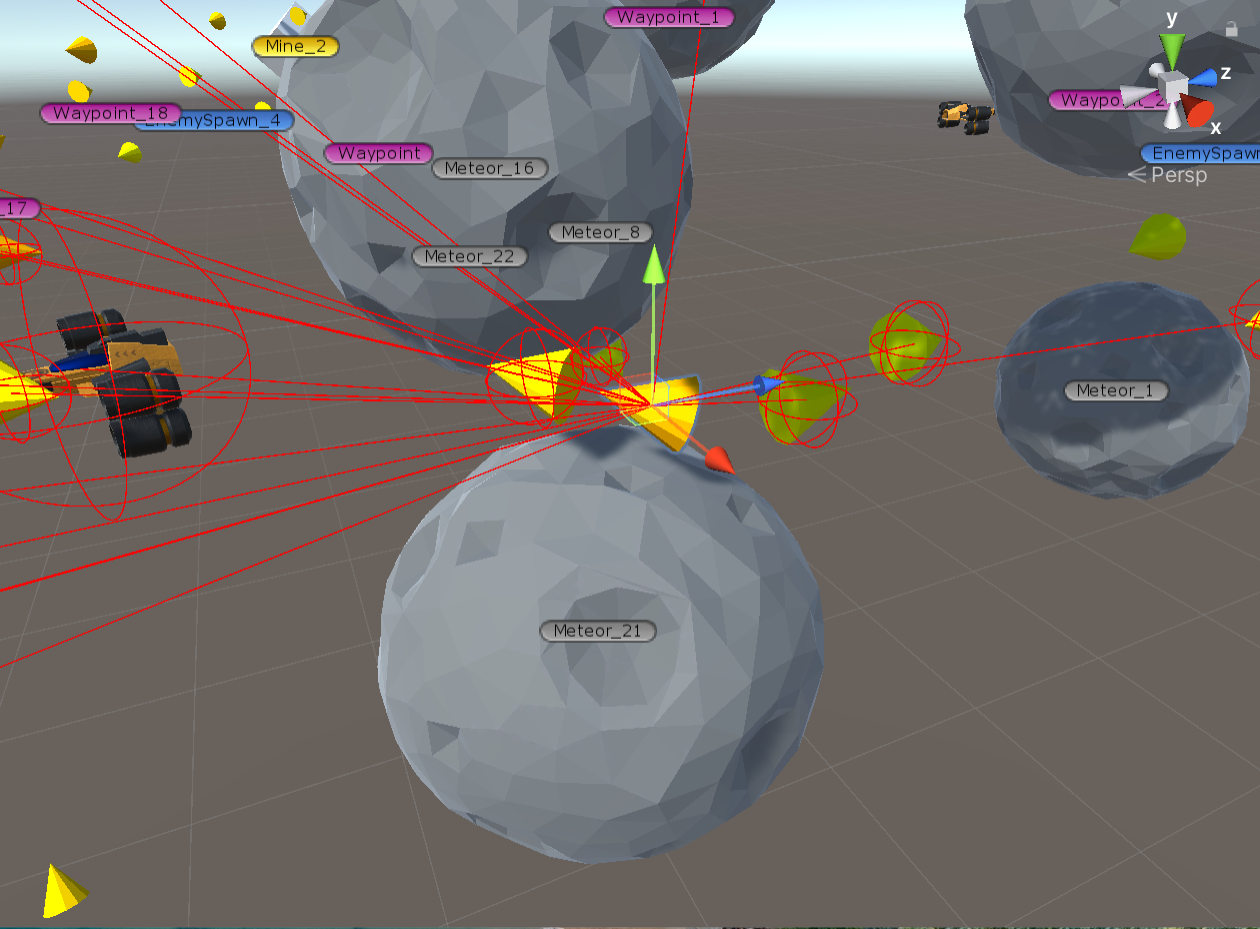
In this section, you can visualize the agent and his nearest environment. This should be done with Gizmos enabled on the game scene:
1.Visualization of the agent radius.
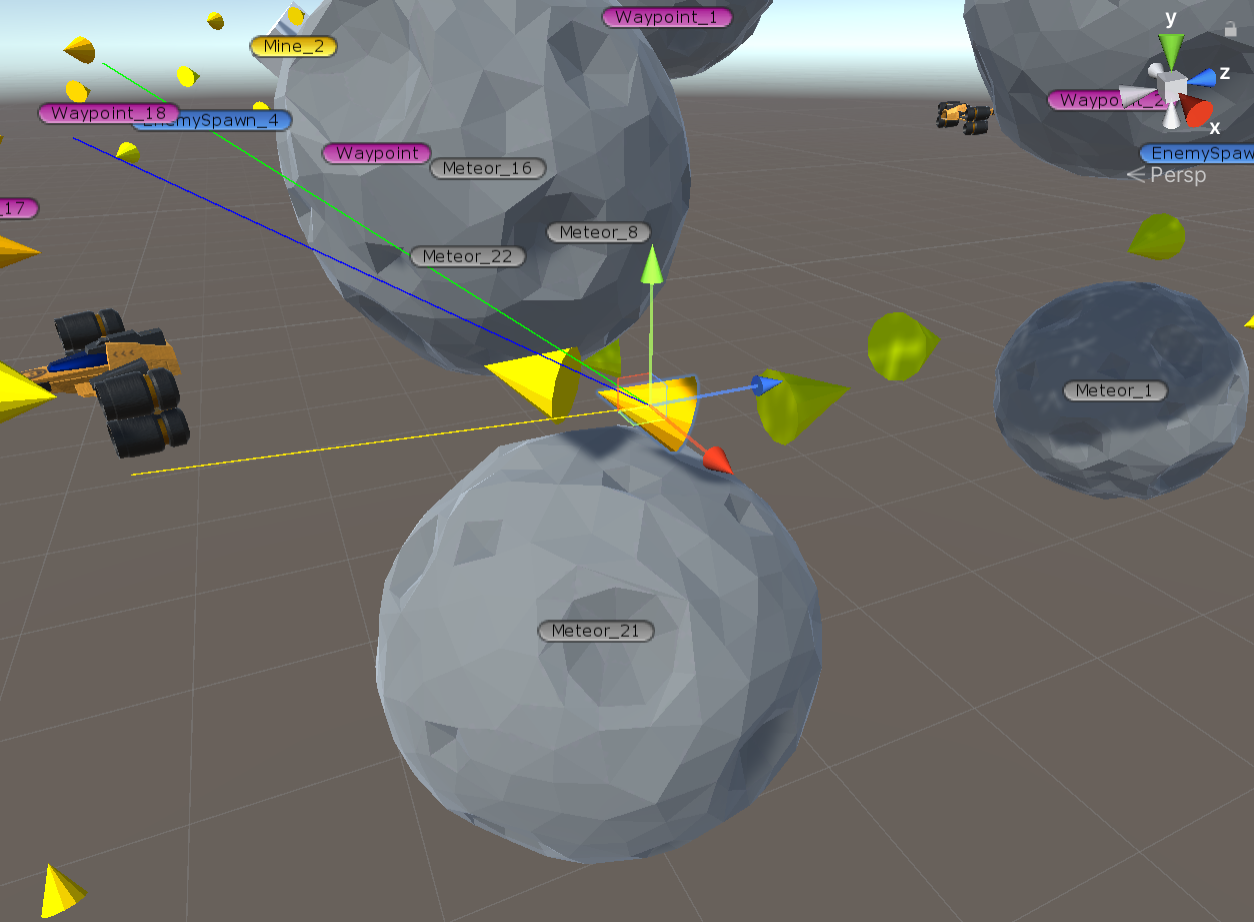
2. Visualization of normalized agent velocities.
Yellow – the path following velocity vector (the direction vector from the agent position to the next target point on the path).
Green – local avoidance vector.
Blue – the blended motion vector (a mixture of the path following vector and the local avoidance vector)
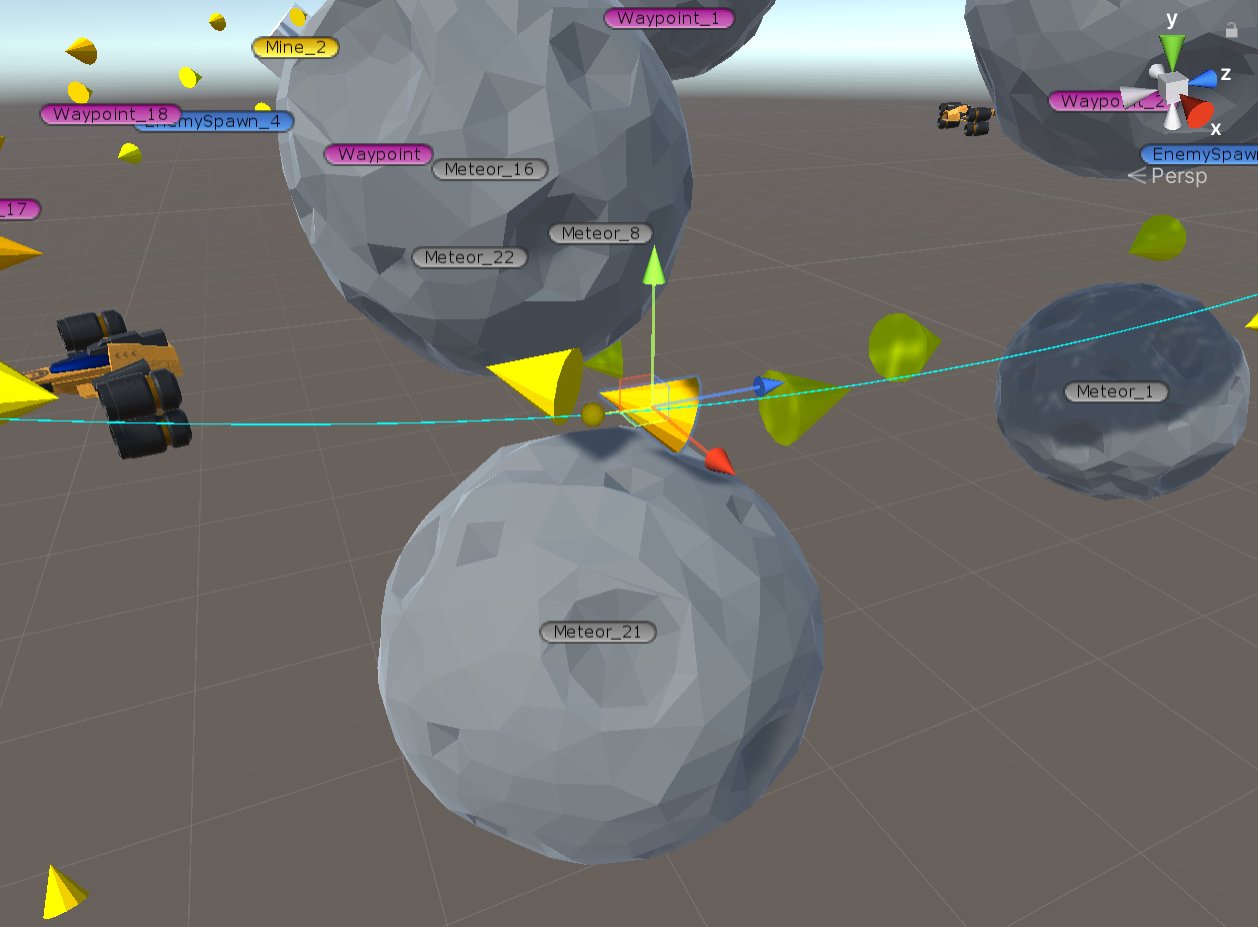
3. Visualization of the path the agent follows.
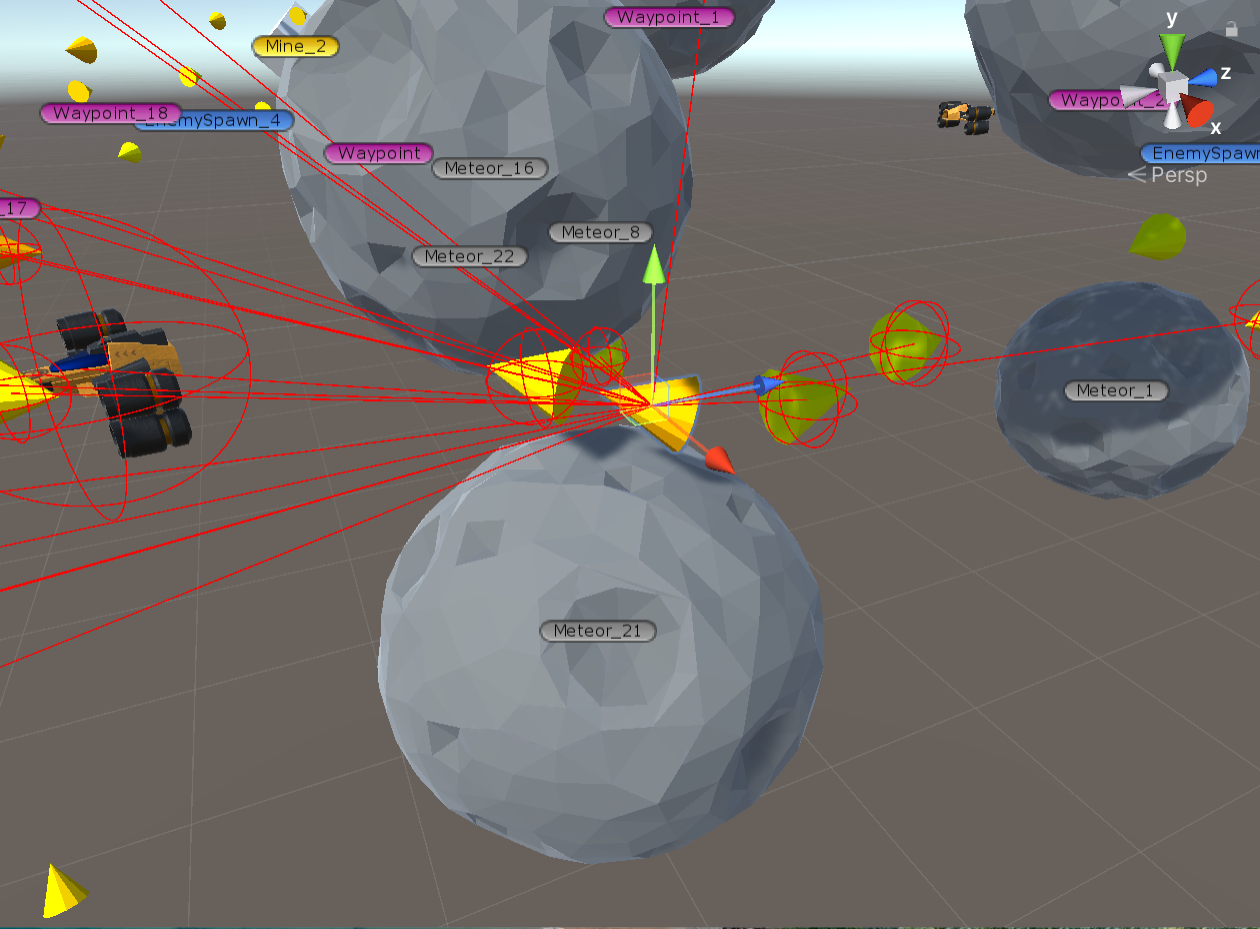
4. Visualization of nearby agents that can be taken into account when performing local avoidance.
When performing local avoidance, depending on the setting of the allowed number of agents under consideration (in the agent description), the n closest agents will be taken from all nearby agents.
5. Visualization of nearby obstacle triangles that are taken into account when performing local avoidance at the moment.
6. All enabled.
